GWC’s Weather Week That Was – July 20 – July 26, 2025
GWC’s Weather Week That Was – July 20 – July 26, 2025
Location: South Plainfield, NJ
Latitude: 40.58 N
Longitude: 74.42 W
| Date | High Temp | Low Temp | Diurnal Range | Rainfall | Peak Rainfall Rate | High Pressure | Low Pressure | Pressure Change |
| 7/20/2025 | 90 | 73 | 17 | 0.00 | 0.00 | 29.94 | 29.69 | 0.25 |
| 7/21/2025 | 86 | 67 | 19 | 0.00 | 0.00 | 29.98 | 29.76 | 0.22 |
| 7/22/2025 | 79 | 63 | 16 | 0.00 | 0.00 | 30.15 | 29.98 | 0.17 |
| 7/23/2025 | 84 | 62 | 22 | 0.00 | 0.00 | 30.22 | 30.15 | 0.07 |
| 7/24/2025 | 89 | 62 | 27 | 0.00 | 0.00 | 30.20 | 29.99 | 0.21 |
| 7/25/2025 | 96 | 70 | 26 | 0.03 | 0.04 | 30.00 | 29.83 | 0.17 |
| 7/26/2025 | 84 | 71 | 13 | 0.01 | 0.01 | 30.09 | 29.95 | 0.14 |
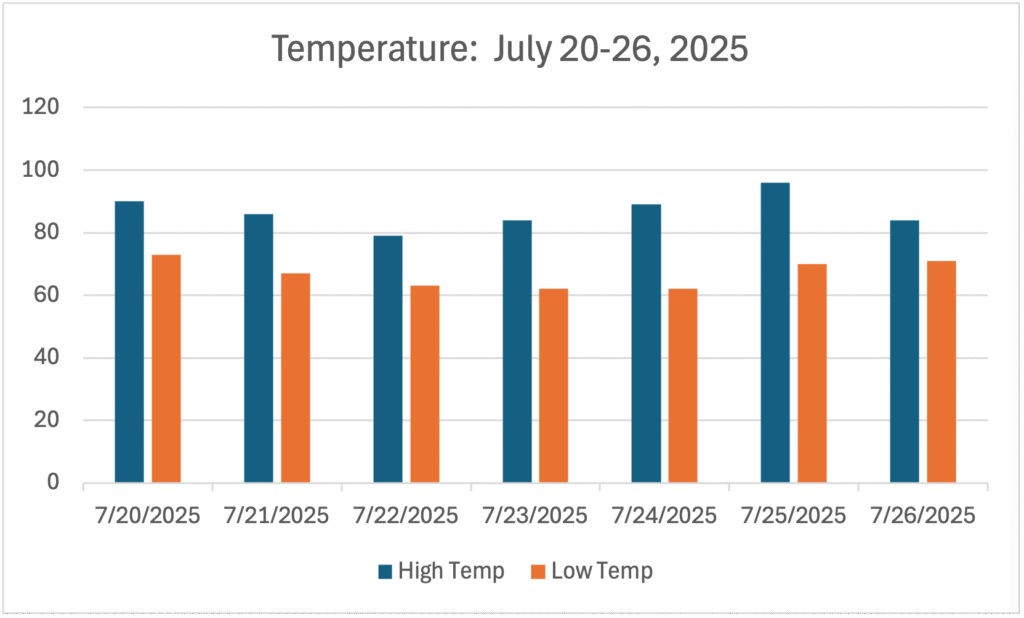
Temperature for the Week of July 20 – July 26, 2025
- Average High Temperature: 86.9°
- Max Temperature: 96° on July 25th
- Min Temperature: 62° on July 23rd and 24th
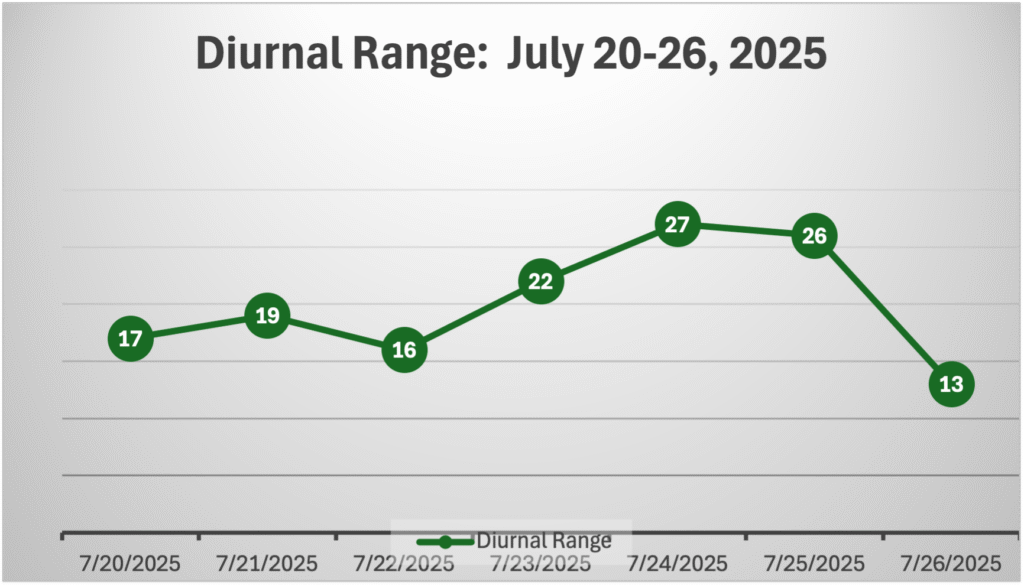
Diurnal Range for the Week of July 20 – July 26, 2025
NOTE: The diurnal range of temperature is the difference between the high temperature and the low temperature on a given day.
- Average Diurnal Range of Temperature: 20.0°
- Max Diurnal Range: 27° on July 24th
- Min Diurnal Range: 13° on July 26th
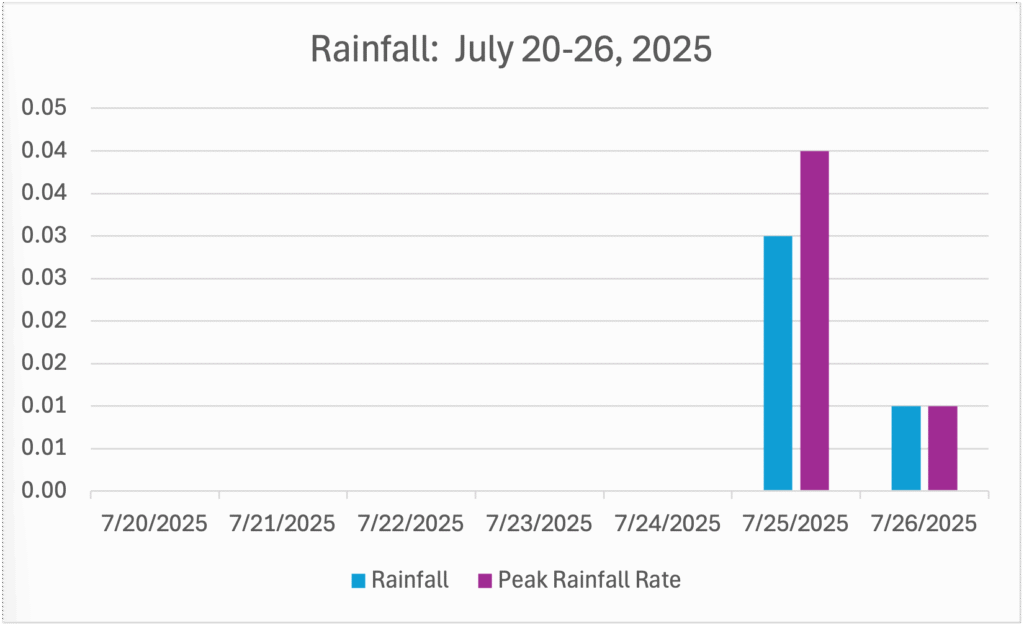
Rainfall for the Week of July 20 – July 26, 2025
- Average Daily Rainfall: 0.01 inches
- Max Rainfall: 0.03 inches on July 25th
- Min Rainfall: 0.00 inches on July 20th, 21st, 22nd, 23rd, and 24th
- Peak Rainfall Rate: 0.04 inches per hour on July 25th
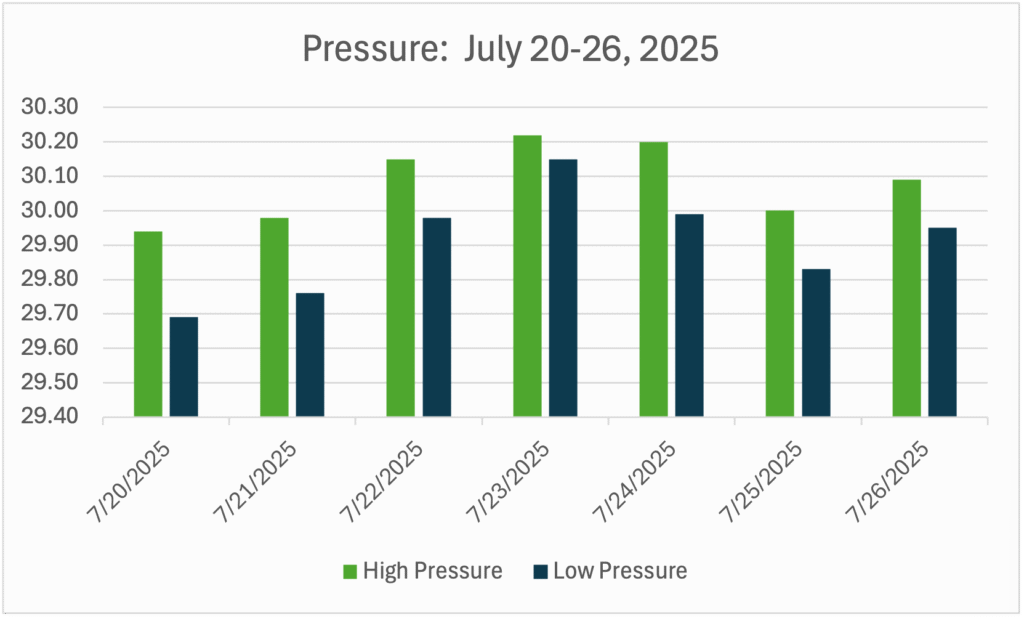
Pressure for the Week of July 20 – July 26, 2025
- Max Pressure: 30.22 on July 23rd
- Min Pressure: 29.69 on July 20th
- Largest Pressure Drop: 0.39 of an inch or 13 millibars from 9:28 AM on July 23rd to 3:15 PM on July 25th.
- Largest Pressure Rise: 0.53 of an inch or 17.7 millibars from 6:10 PM on July 20th to 9:28 AM on July 23rd.
Summary
The last full week of July 2025 was uneventful for the most part. There wasn’t much rain, and thankfully, no severe weather to talk about. GWC sweltered through two 90° days during the week including the second highest temperature of the month on July 25th. One day, July 22nd, had a high temperature below 80°, which helped bring the average temperature for the week down to below 87°. The week was mostly dry with two days of measurable rainfall on July 25th and 26th, and they combined for only 0.04 of an inch.